
In this article, you will learn how to access and analyze the Jobs and Job Statistics reports to monitor performance and operational efficiency.
As your operation grows, tracking job statuses, revenue, and overall team efficiency becomes essential for smooth daily operations. JobyDesk provides dedicated reporting dashboards to help you monitor revenue, identify field performance trends, and eliminate workflow bottlenecks.
Viewing the Jobs Report
In order to view high-level metrics, revenue figures, and individual job logs, you will need to access your Reports dashboard.
1. Navigate to Reports:
On the left sidebar, click the Reports tab. Locate the Operations section and select Jobs.
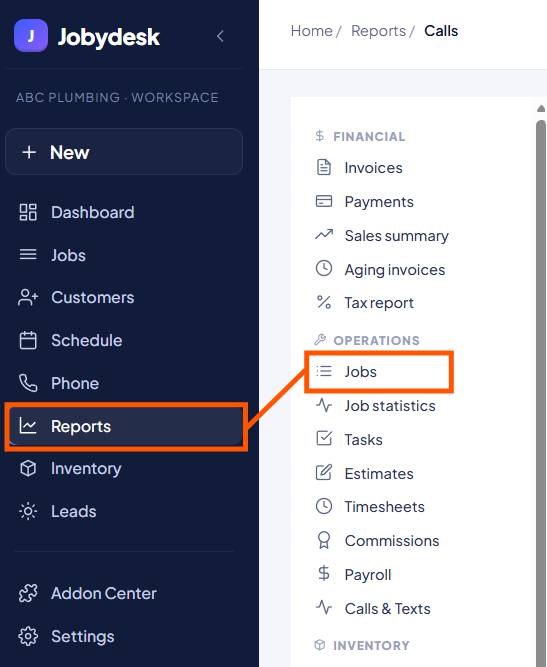
2. Filter Your Data: Use the filter controls at the top of the screen to refine your view:
- Filter by specific Technicians.
- Select a custom date range (e.g., the last 30 days).
3. Review Metric Cards:
Inspect key numbers displayed near the top:
- Total jobs booked
- Completed jobs
- Current jobs in progress
- Total generated revenue
- Average duration per job
4. Analyze Dashboard Charts:
Scroll down to analyze visual breakdowns:
- Jobs by Status: Review the pie chart to track complete, unconfirmed, or scheduled jobs.
- Jobs by Technician: Use the leaderboard to review individual job completion counts.
Examine Detailed Job Logs:
Scroll to the bottom table to inspect or export job details:
- View the assigned customer, job type, responsible technician, and current status.
- Click the export buttons in the top right corner to download the report list.
The Jobs report primarily focuses on tracking generated revenue, ticket counts, and individual job statuses, whereas the Job Statistics report focuses on team efficiency and execution performance KPIs.
Analyzing Job Statistics
In order to evaluate company performance metrics and busy hours, you will need to access the Job Statistics area.
1. Open Job Statistics:
On the left sidebar under the Reports area, click Job Statistics.
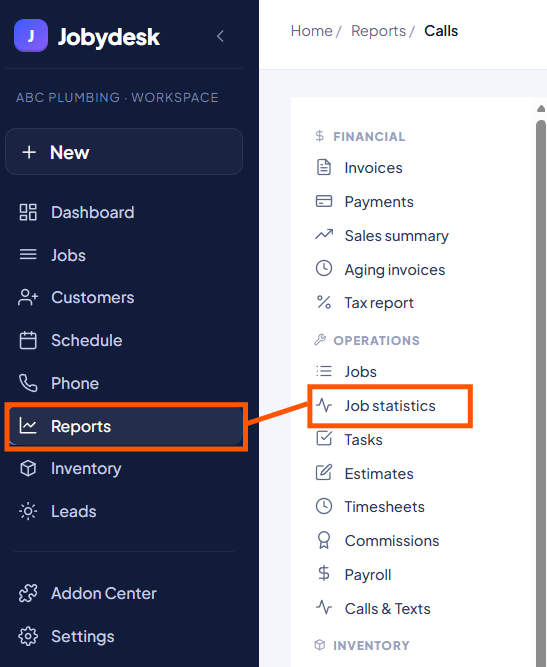
2. Review Operational KPIs:
View summary cards for company performance metrics:
- Average response time
- Average duration to complete a job
- Total job count
- Overall completion rate
3. Inspect the Heat Map:
Examine the Job Volume by Hour heat map to identify peak activity periods in the field.
4. Evaluate Job Types:
Review the bottom table grouped by service categories to compare average job durations and ticket values across service types.
Monitoring operational metrics like average response time and job duration helps identify dispatch bottlenecks and refine technician scheduling.