
In this article, you will learn how to monitor your sales pipeline and track internal operational task completion using JobyDesk reports.
Using the Estimates and Tasks reports together allows you to gain complete oversight of your field service operations. Tracking your estimates helps you evaluate win rates and manage pending quotes, while managing tasks ensures team accountability and timely execution of internal steps required to complete jobs.
Accessing and Navigating Estimates Reports
In order to view sales performance metrics and detailed estimate statuses, you will need to access your Reports section.
1. Navigate to Estimates Reports:
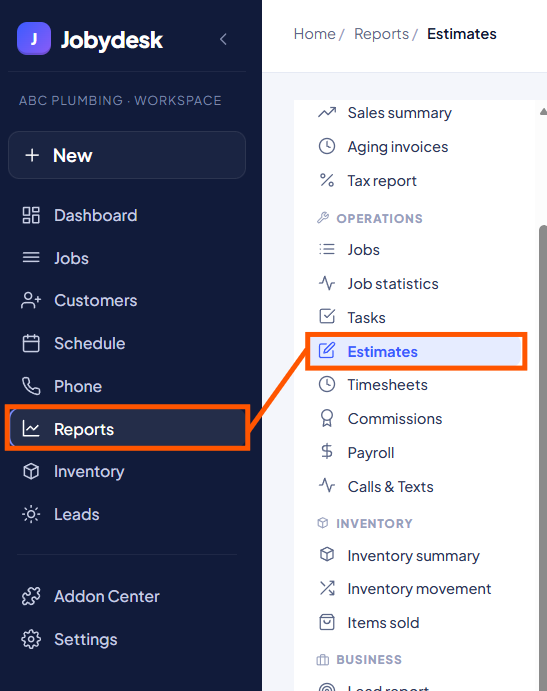
Click on the Reports tab on the left sidebar, then select Estimates.
2. Apply Filters:
Use the dropdown filters at the top to filter the dashboard by specific technicians or date ranges (e.g., last 30 days).
3. Review Metric Cards:
Analyze key pipeline metrics displayed near the top of the dashboard:
- Estimate Sent: Displays the total volume of quotes issued.
- Approved: Tracks total wins and automatically calculates your win rate percentage.
- Pending: Shows the number of quotes currently awaiting a customer reply.
- Declined: Tracks lost quotes along with your overall loss rate.
- Value Approved: Displays total dollar amount won and your average ticket value.
- Average Time to Sign: Measures how long customers take to approve quotes after they are sent.
4. Analyze the Conversion Funnel:
View the Estimate Outcomes chart to analyze conversion data, broken down by total estimates, customer response rate, and percentage of approvals.
5. Inspect the Detailed Estimate Log:
Scroll down to the table at the bottom to view individual estimate details, including Estimate ID, Customer Name, Date Sent, Total Value, and Current Status.
- Filter the log using the quick tabs: Draft, Sent, Approved, or Declined.
Managing Task Completion Reports
In order to monitor operational workflows and keep your team accountable, you will need to access your task management reports.
1. Navigate to Tasks Reports:
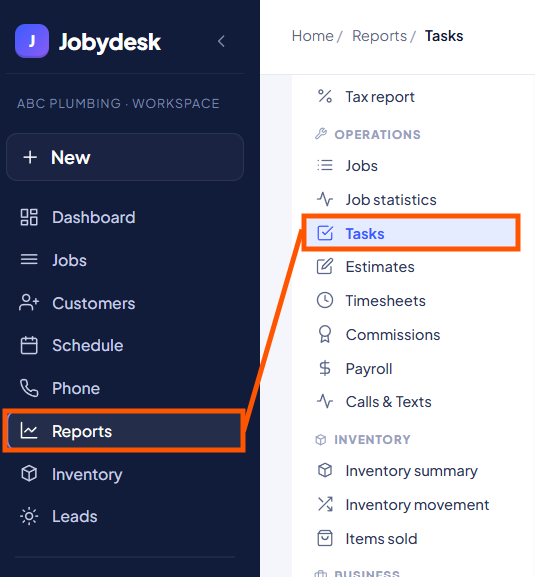
Click on the Reports tab on the left sidebar and select Tasks.
2. Review Task Metrics:
Monitor operational status cards at the top:
- Open Tasks: Displays total outstanding to-dos, including those due today.
- Completed: Shows tasks finished within the selected timeframe.
- Overdue: Highlights tasks requiring immediate attention.
- Average Time to Close: Tracks overall team speed in completing assignments.
3. Monitor the Task Burndown Chart:
Review the visual graph below the metrics to track open tasks over time and prevent work bottlenecks.
4. View Detailed Task Assignments:
Use the task log table at the bottom to view linked job details, assigned team members, due dates, and statuses.
- Filter the list by Due Today, Overdue, or Done.
- Click export options on the right side of the screen if you need to extract task data.
You can regularly review and export these reports to maintain optimal team efficiency and ensure no job requirements slip through the cracks.